
Brand Analysis helps to better understand the drivers of business and brand value. Understanding how value is created, where it is created and the relationship between brand value and business value is a vital input to strategic decision making.
By furthering knowledge of this relationship, you will be able to leverage your brand value and ultimately maximise shareholder value.
In our brand analytics for the Fuel industry of Mauritius, Vivo Energy leads the online presence by capturing the highest share of voice (SoV) for the month of May 2016.
What is Brand Analytics?
We define a “brand” as the sum of all feelings, thoughts and recognitions that a target audience will have about a company. Consequently, the definition of brand analytics or brand analysis is:
“Our ability to quantitatively measure all the feelings, thoughts, interactions, and recognitions from a target audience.”
These quantitative measurements, or brand metrics, are then put together to help companies make informed business decisions that will strengthen the brand insights, drive marketing, drive sales, and increase long-term profitability.
Metric details
Daily Activity represents the volume of mentions picked up by days of the week across four time intervals (12AM – 6AM, 6AM – 12PM, 12PM – 6PM and 6PM – 12AM) for monitored brands.
Popular Sources outline the share of mentions picked up for each monitored brand of the Fuel industry by sources.
Methodology
This report was conducted for the period May 1st to May 31st 2016, where our tool scanned the internet from news websites to social networks in Mauritius. Real time information for instance brand mentions, complaints and concerns were picked up to derive business value in complex, expressive, and sometimes-confusing human language. The report was done for the Fuel industry whereby we have monitored four brands namely: Vivo Energy, Engen Petroleum, Total and Indian Oil on a real time basis. The analysis is broken into Part A which details SoV, Daily Activity and Popular Sources for the four monitored brands and Part B which focus on the three most popular brands of the Fuel industry.
Part A – Industry Analysis
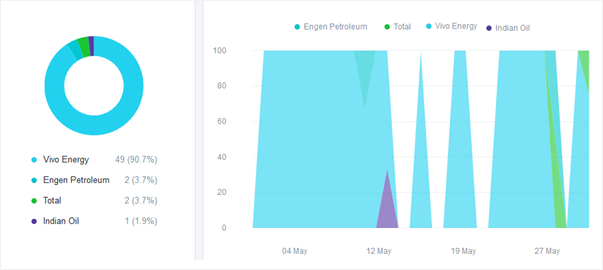
Share of voice
As depicted by the doughnut, Vivo Energy has led the race on the online platform with 49 mentions followed by Engen Petroleum and Total with 2 mentions respectively.
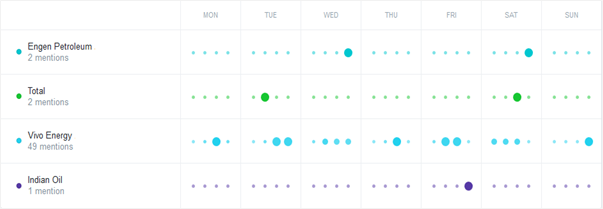
Daily Activity
The highest activity for the monitored brands of the Fuel sector was recorded on Tuesdays followed by Mondays and Fridays from 6PM to 12AM followed by 12PM to 6PM and 6AM to 12PM respectively.
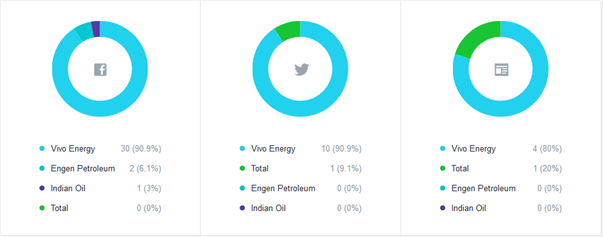
Popular Sources
During the period under review, the highest number of mentions picked up for the monitored brands were from Facebook followed by Twitter, News, Videos and Images.
Part B – Brand Analysis
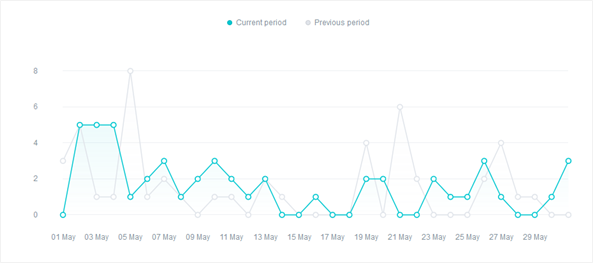
Vivo Energy Brand
As depicted by the line chart, the highest volume of daily mentions picked up for Vivo Energy (5 mentions) was on 2nd, 3rd and 4th of May respectively.
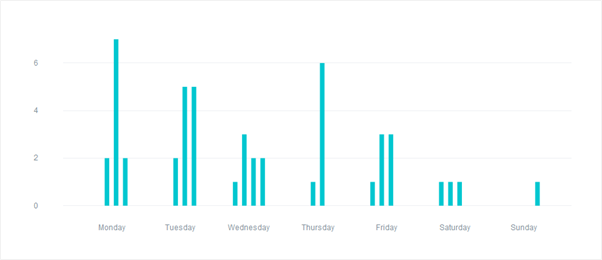
As illustrated by the column chart, the highest daily activity for Vivo Energy was from 12PM to 6PM on Tuesdays (12 mentions) followed by Mondays (11 mentions) and 6AM to 12PM on Wednesdays (8 mentions).
As shown below, Vivo Energy sources were mainly geared towards Facebook followed by Twitter, News, Videos and Images. It is to be noted that, Vivo Energy has done promotional activities for “Road Safety campaign”, “Mother’s Day”, “Euro 2016” and “Smart Club members” during the period under review on Facebook.

Engen Petroleum Brand
As depicted by the line chart, Engen Petroleum picked up 1 daily mention on 11th and 28th of May respectively.

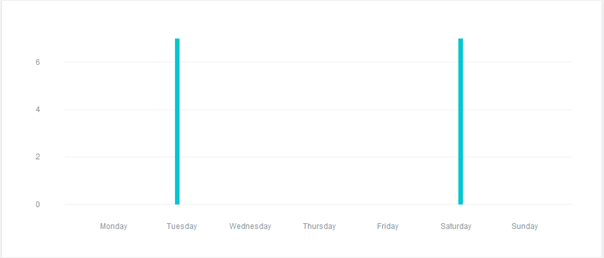
As illustrated by the column chart, daily activity for Engen Petroleum was on Wednesday (1 mention) and Saturday (1 mention) from 6PM to 12AM respectively.

As shown below, Engen Petroleum was present only on Facebook where it has done promotional activities for “Mother’s Day” on 28th of May.
![]()
Total
As depicted by the line chart, Total picked up 1 daily mention on 28th and 31st of May respectively.

As illustrated by the column chart, Total recorded daily activity on Tuesday (1 mention) and Saturday (1 mention) from 6AM and 12PM and 12PM to 6PM respectively.
As shown below, Total was mostly present on Twitter and News platforms.

Our Analytics team will be pleased to discuss how Sentiments Analysis can add value to your online brand management. Contact us on2331636 or via email: contact@infosystems.mu for further information.